Grahical User Interface
This page provides a user guide the MIP Dataset Mapper (mip_dmp) UI tool.
0. Launch the UI
The UI can be launched by running the following command:
$ mip_dataset_mapper_ui
This will display the main window of the UI:
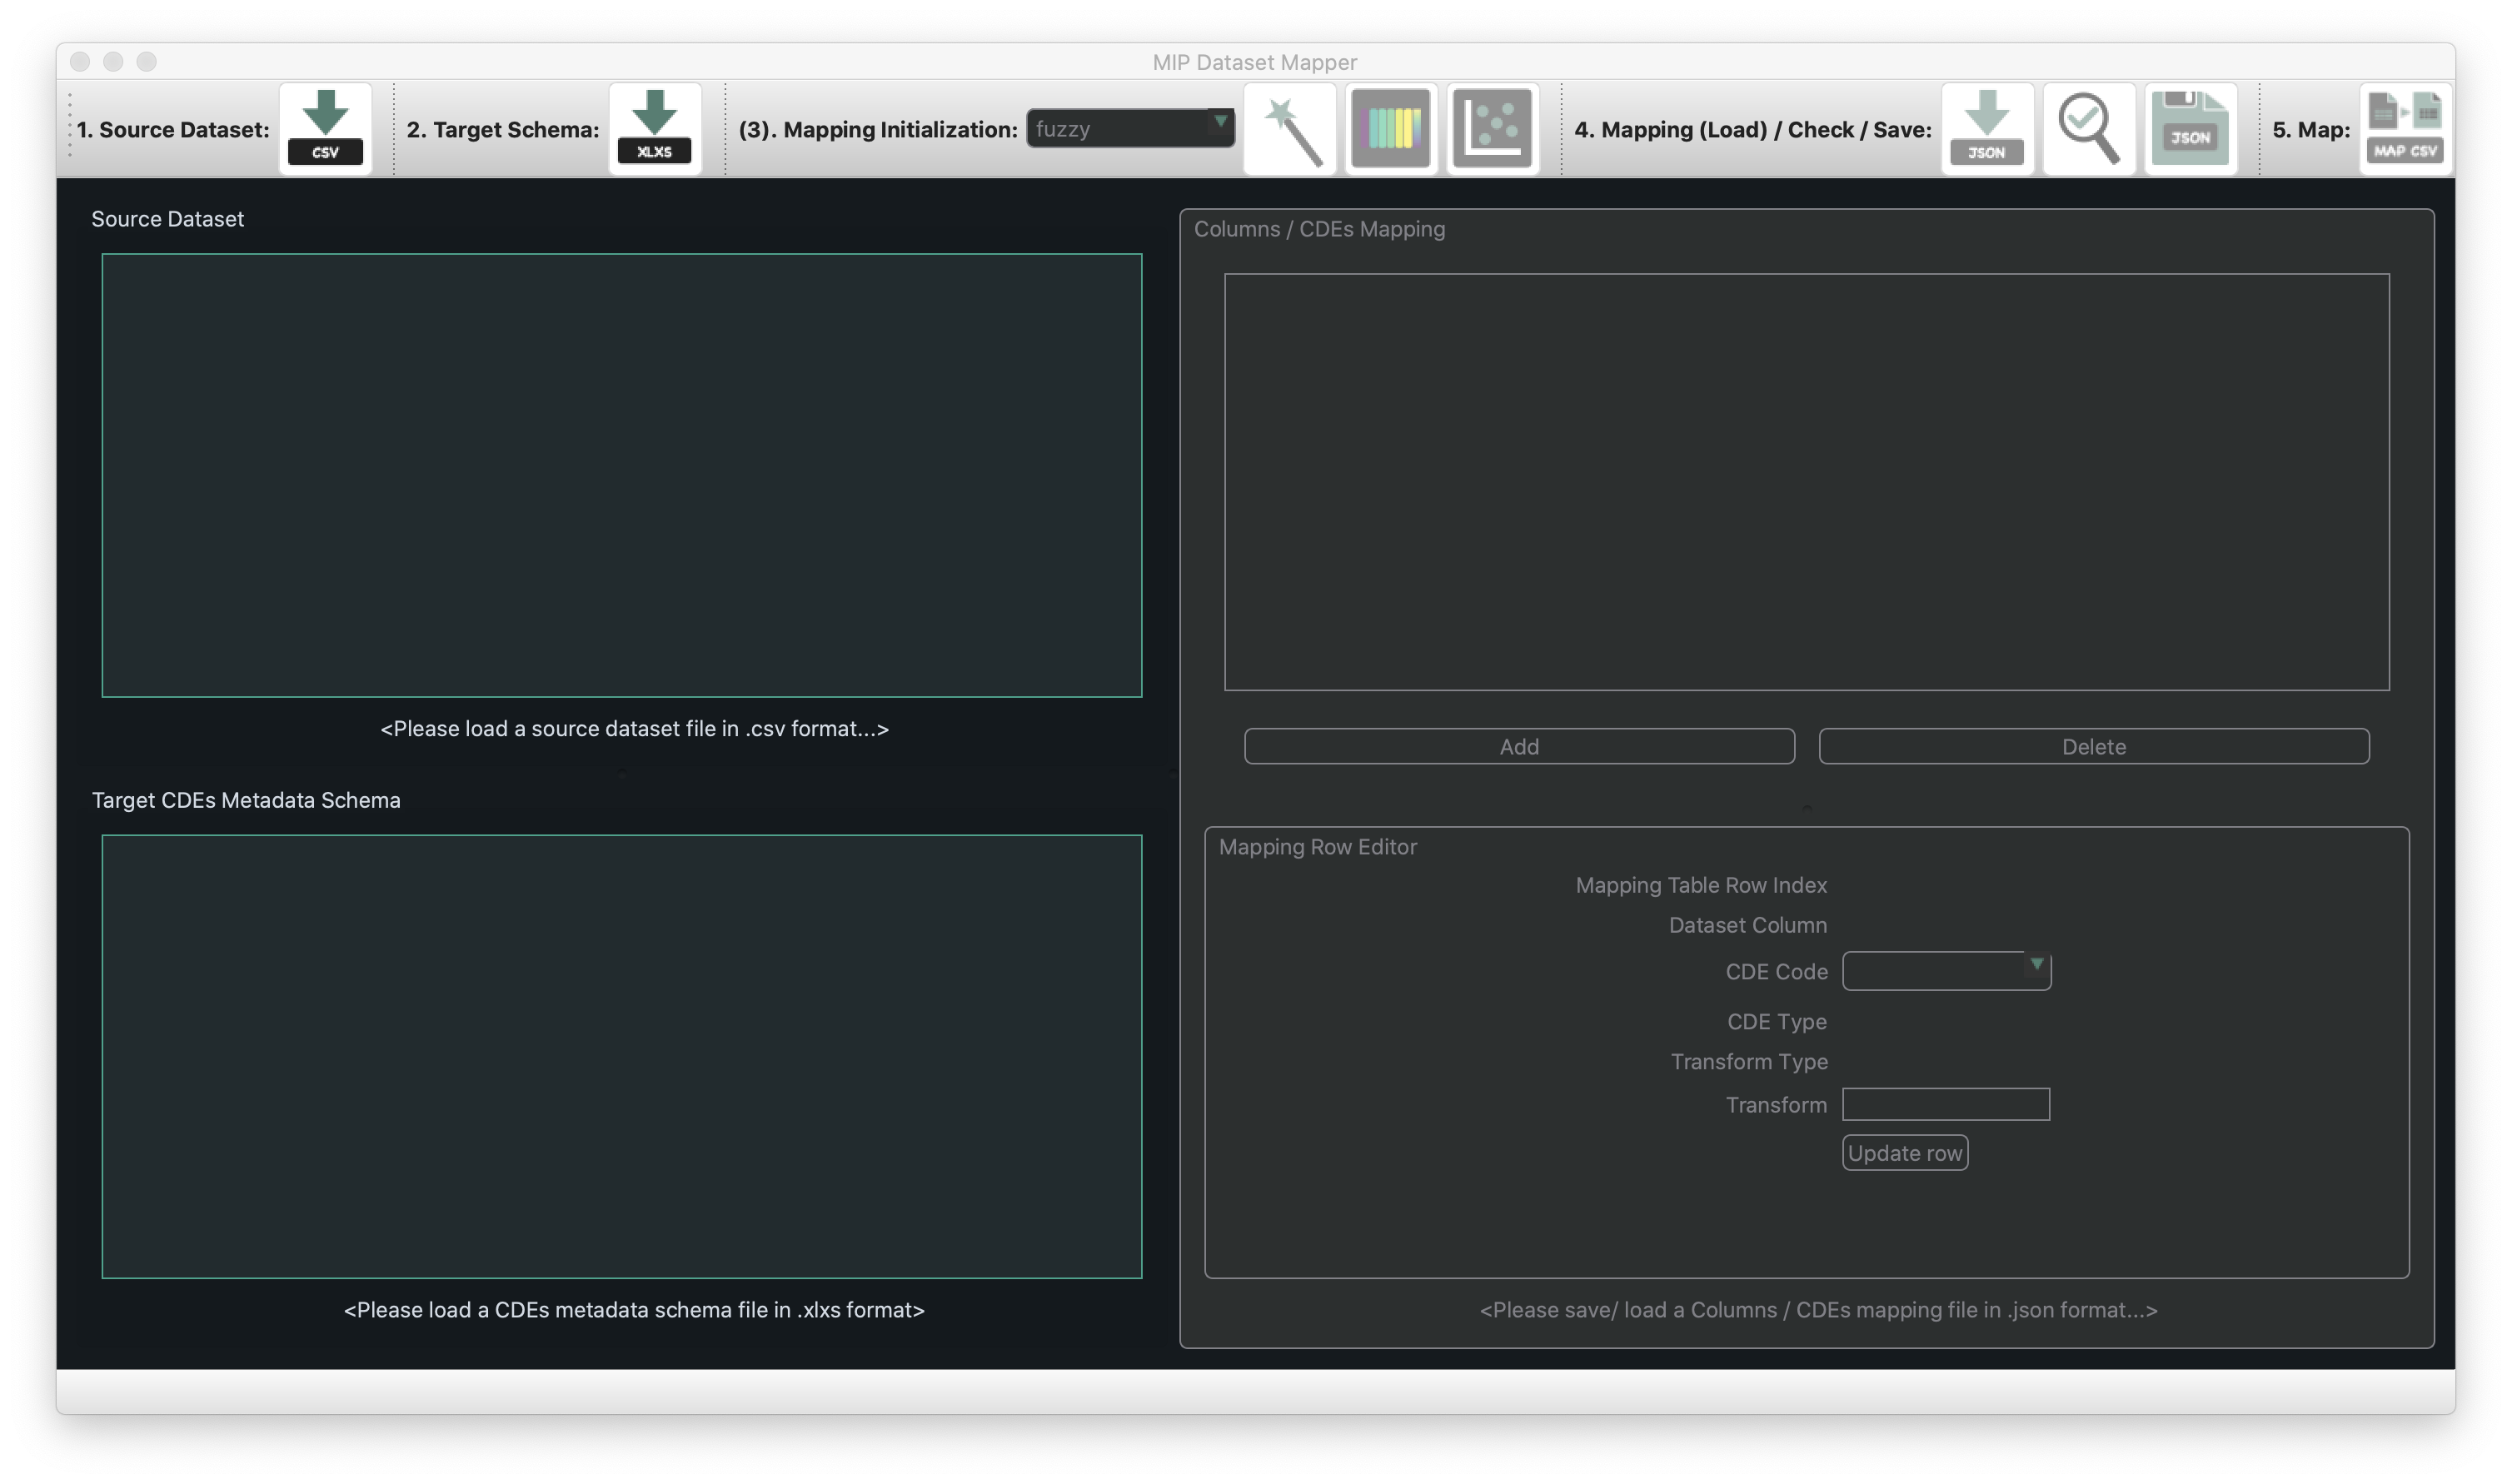
The UI is composed of 3 main parts:
The menu bar (at the top of the window) provides access to the different functionalities of the UI.
The main window panel (in the middle of the window) displays the different components of the UI:
The Source Dataset component (on the top left) displays the content of the source dataset.
The Target CDEs Metadata Schema component (on the bottom left) displays the content of the target Common Data Elements (CDEs) metatadata schema.
The Columns / CDEs Mapping component (on the right) displays the different mappings between the columns of the source dataset and the CDEs of the target metadata schema, and provide mapping table row editor.
The status bar (at the bottom of the window) displays the status of the UI.
The different steps of the UI workflow are described in the following sections.
1. Load a source dataset
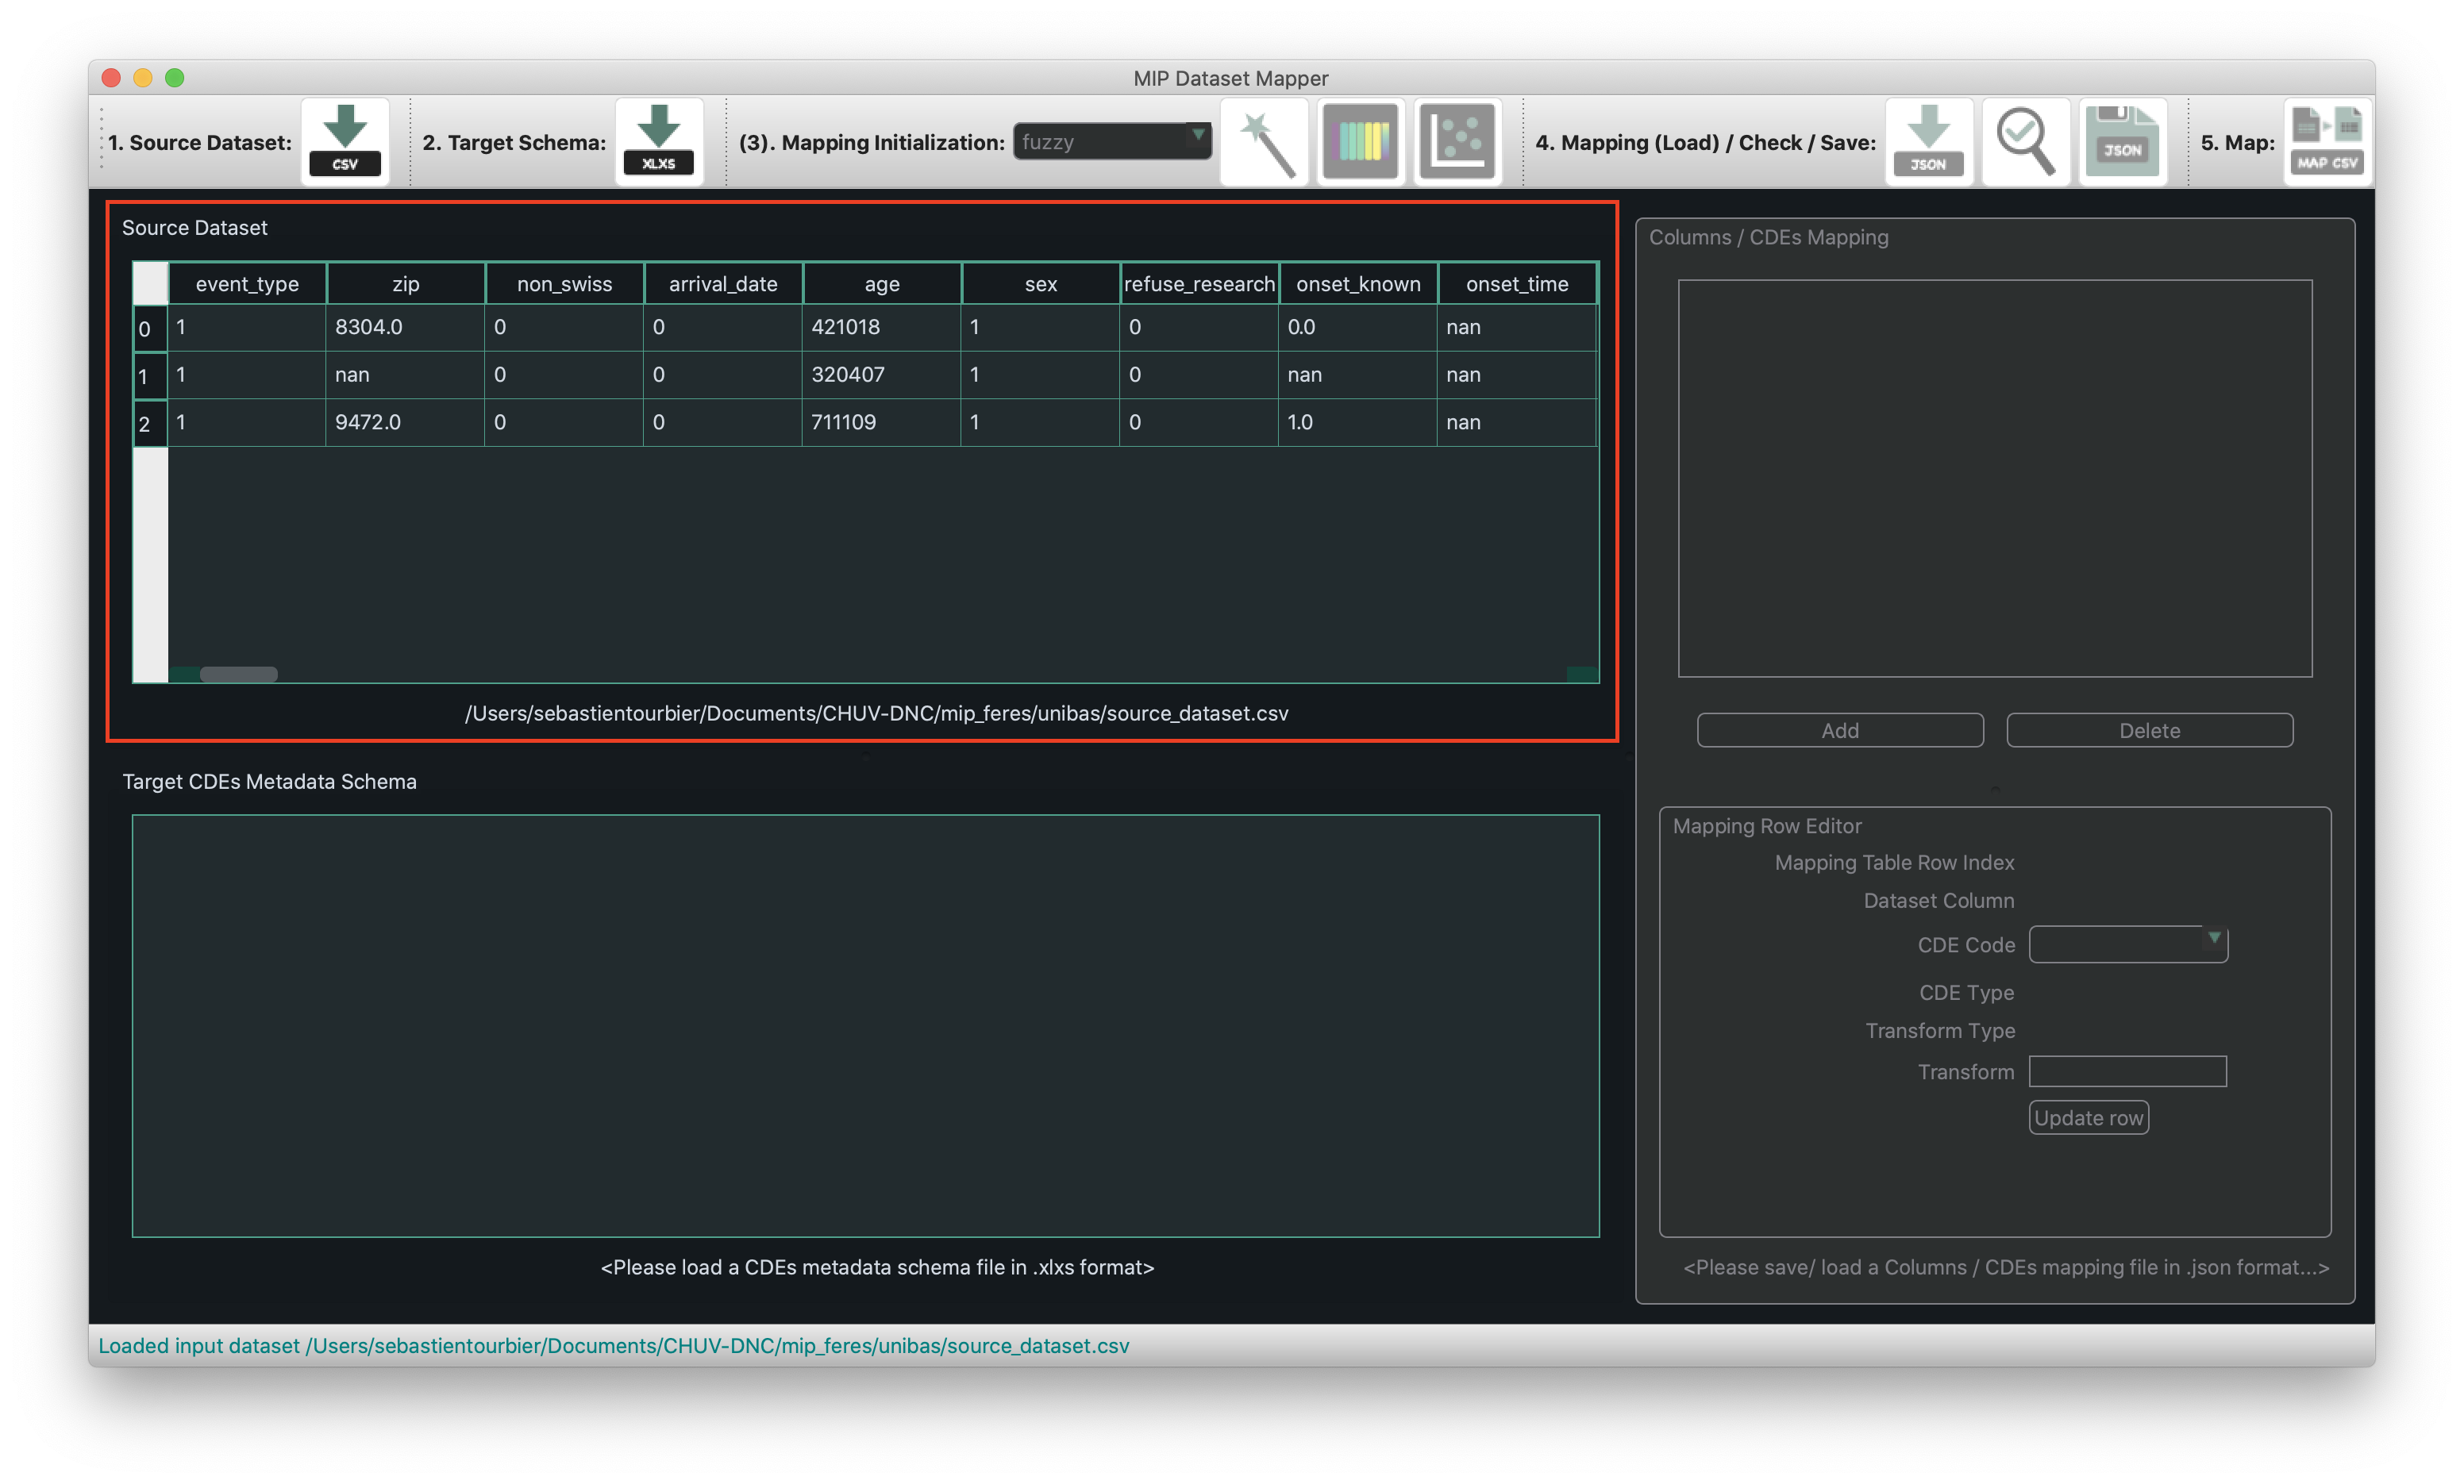
The first step of the UI workflow is to load a source dataset. This can be done by clicking on the Load CSV button of the Source Dataset component of the menu bar:

This will open a file dialog window allowing to select a CSV file. Once a CSV file is selected, the content of the file is displayed in the Source Dataset component of the main window panel:
2. Load a target CDEs metadata schema
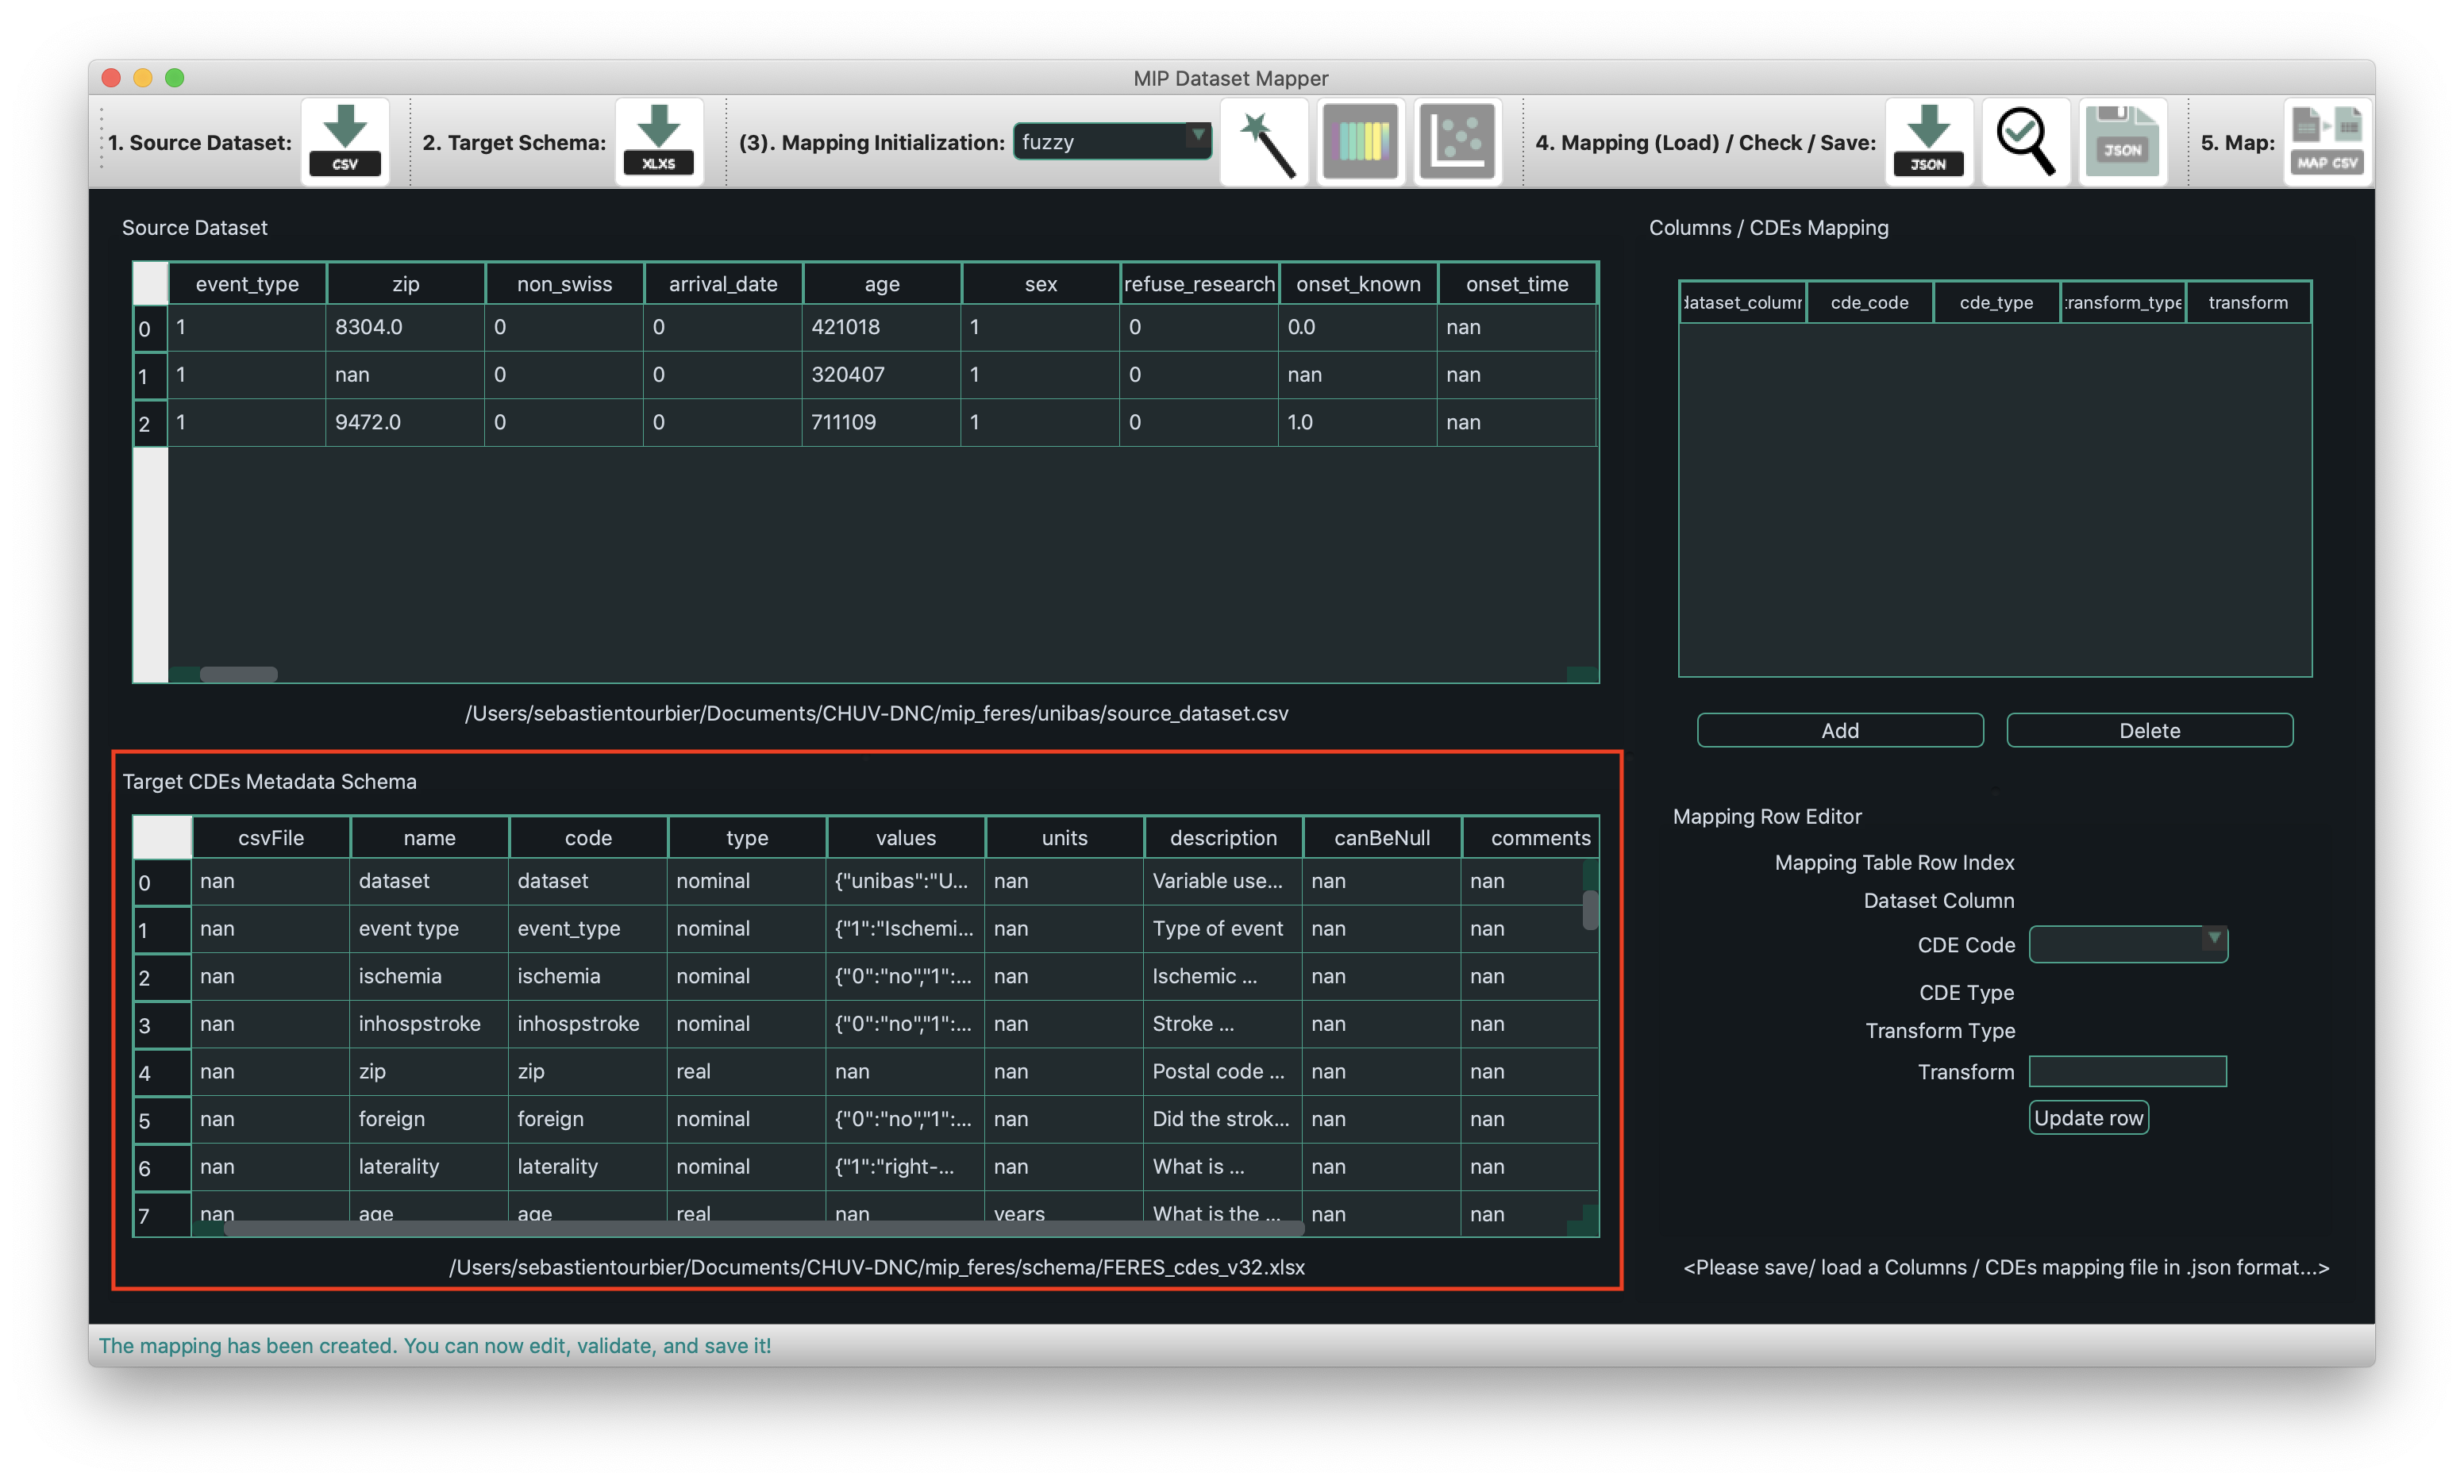
The second step of the UI workflow is to load a target CDEs metadata schema. This can be done by clicking on the Load XLXS button of the Target Schema component of the menu bar:

This will open a file dialog window allowing to select a XLSX file. Once a XLSX file is selected, the content of the file is displayed in the Target Schema component of the main window panel:
3. Create the mappings
The third step of the UI workflow is to create the mappings between the columns of the source dataset and the CDEs of the target metadata schema. This can be done following (1) a manual or (2) a semi-automatic approach.
3.1 Manual approach
The manual approach consists in creating the mappings manually by clicking on the Add button below the table of the Columns /CDEs Mappings component of the menu bar:
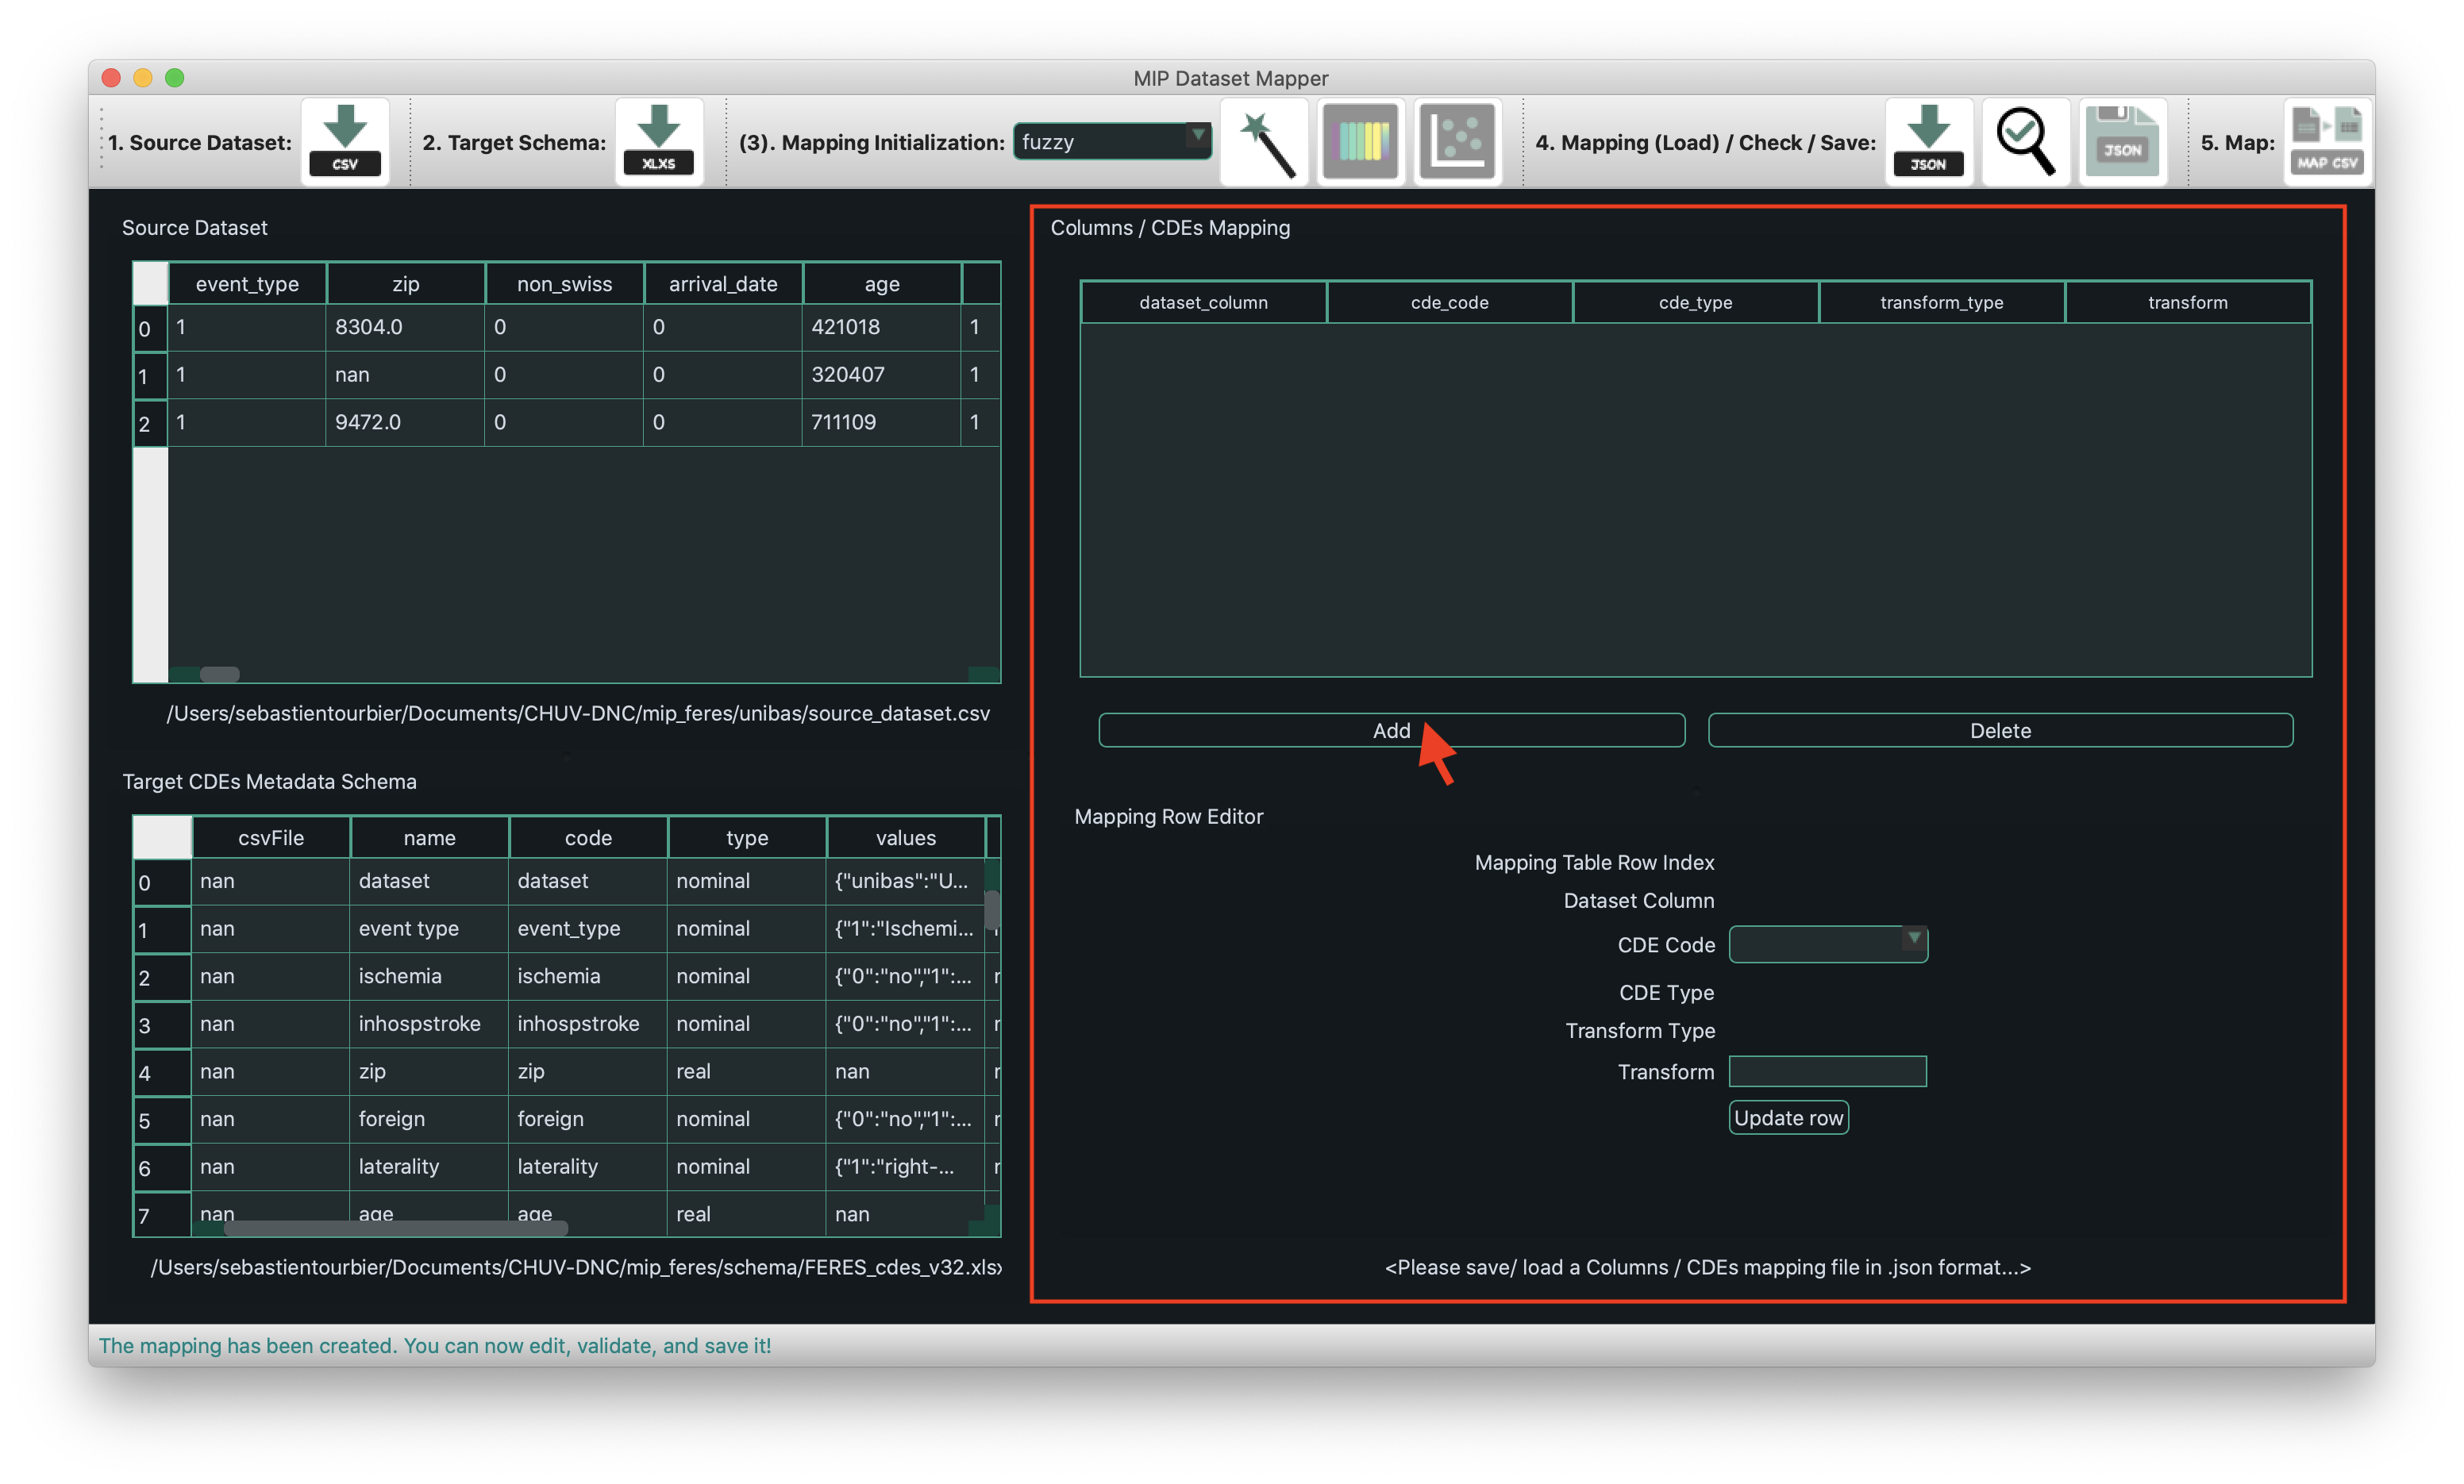
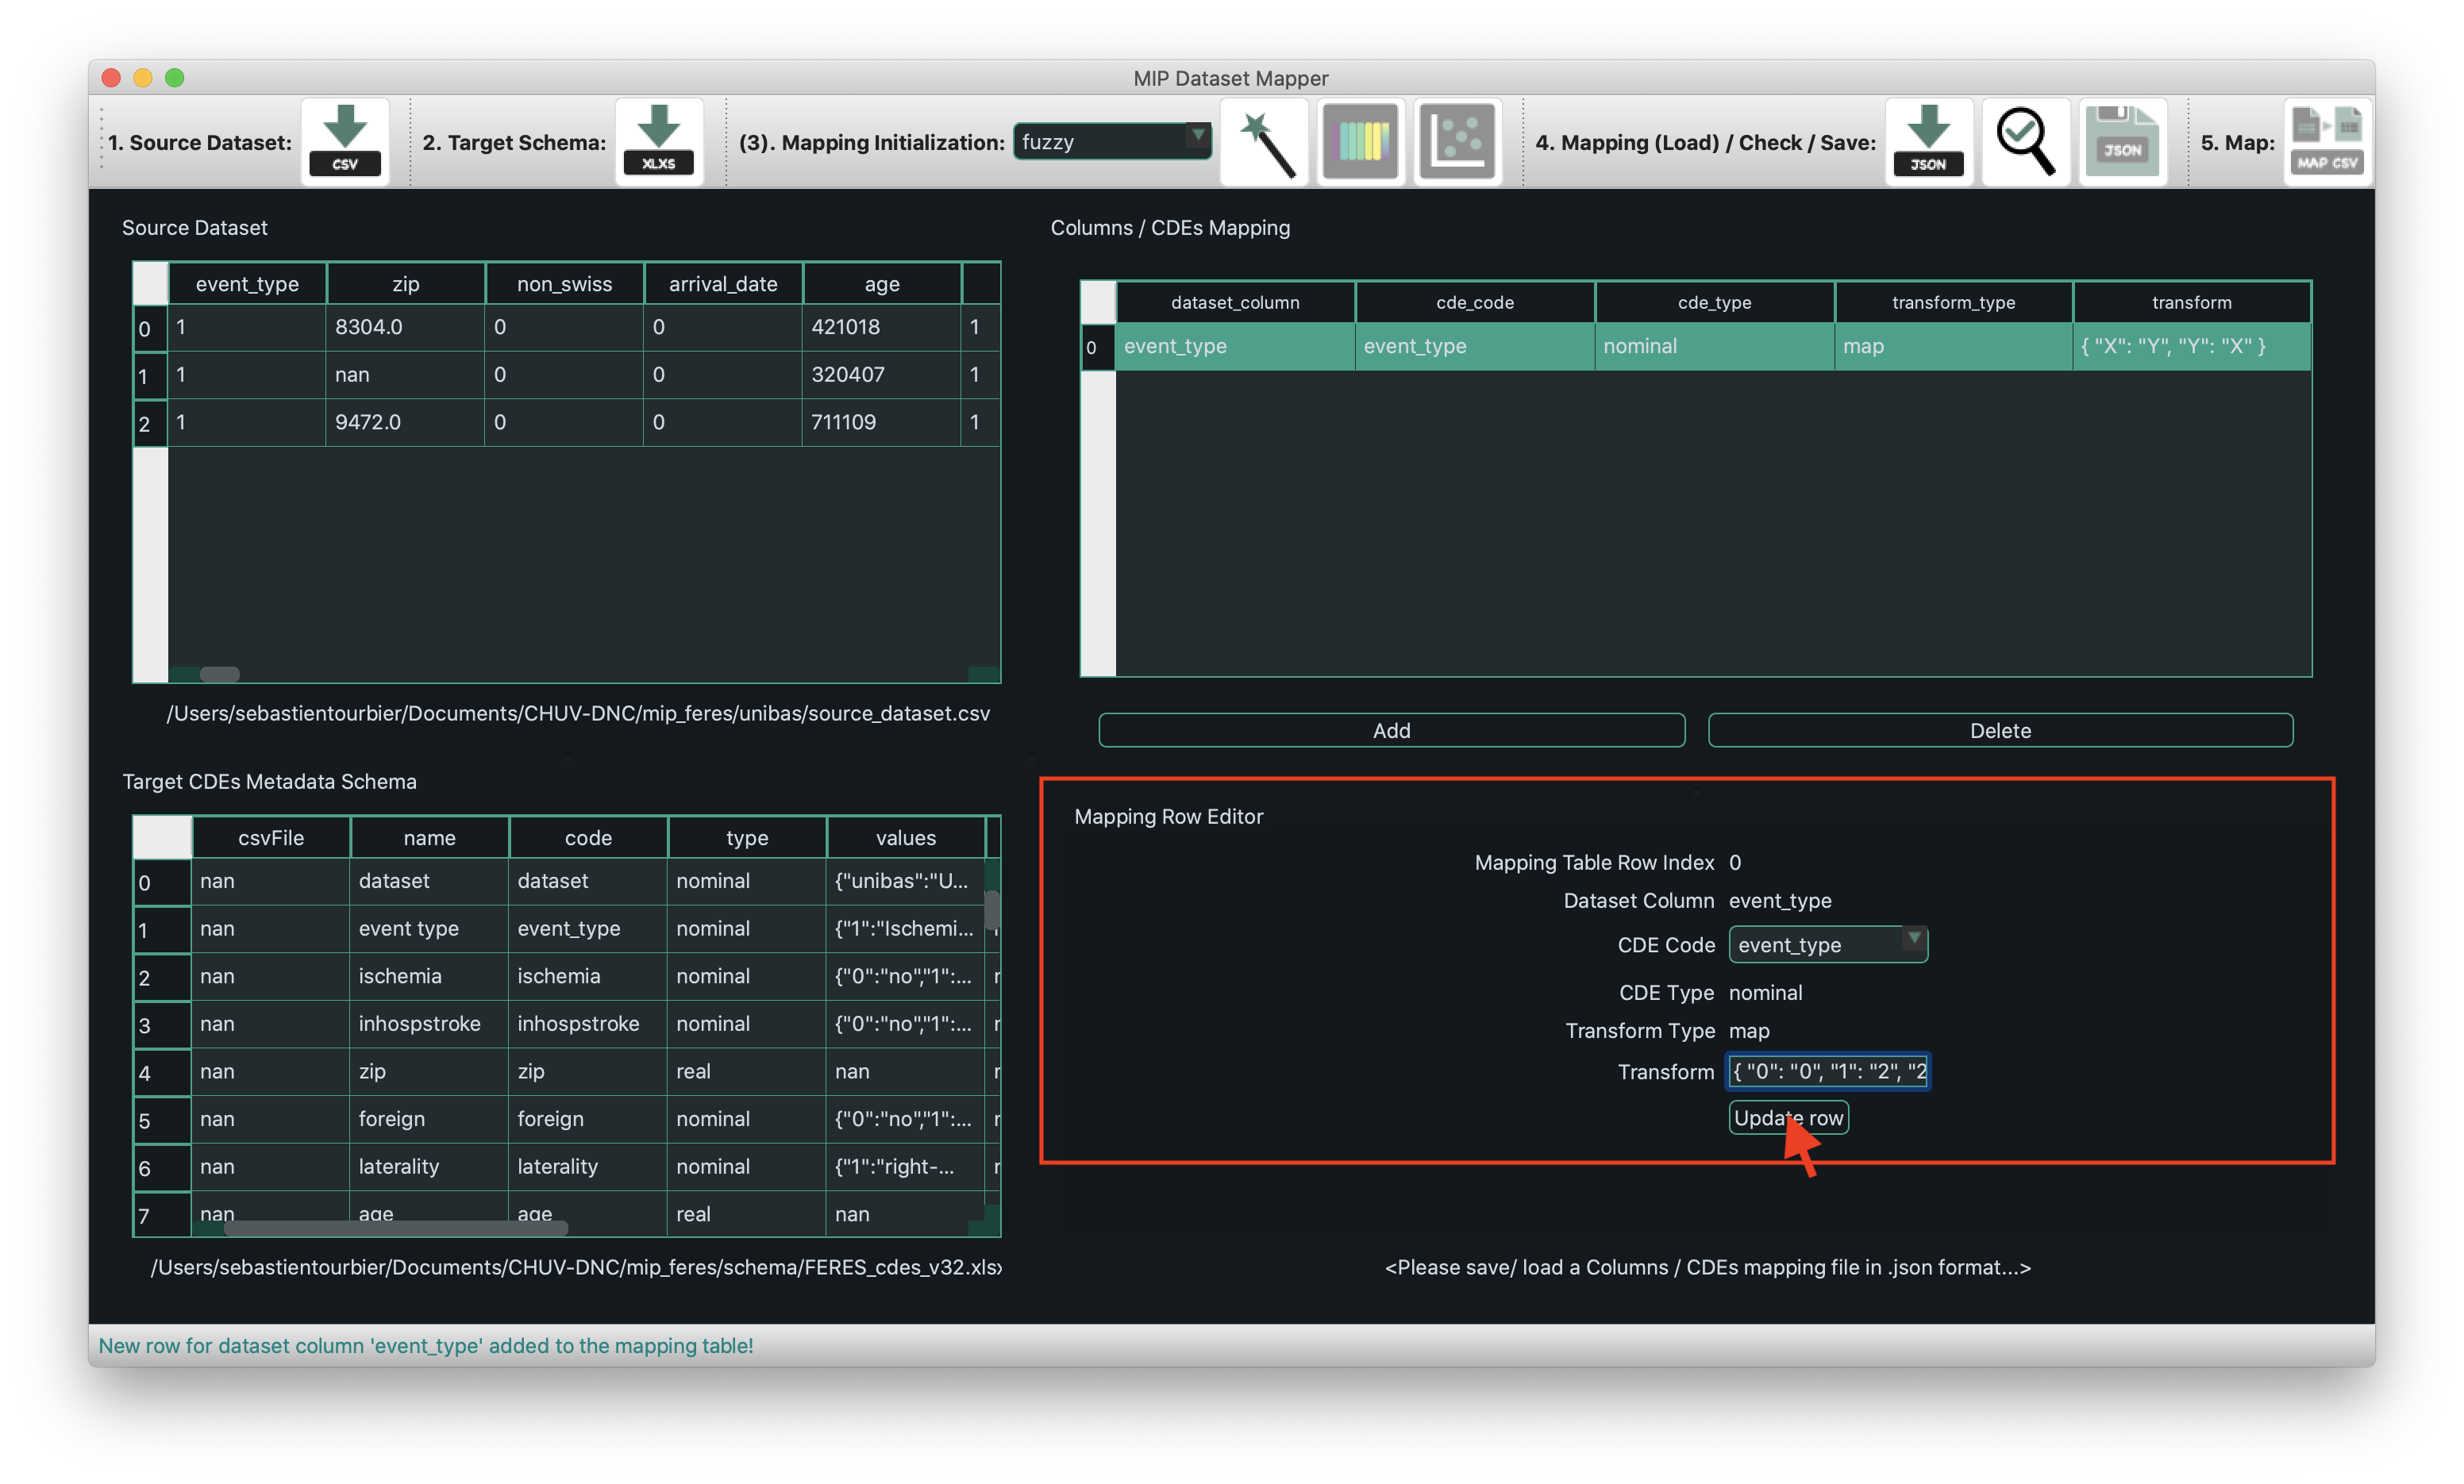
This will open a dialog window allowing to select a column of the source dataset. A first matched CDE code is still proposed automatically by leveraging Fuzzy Text Matching from the fuzzywuzzy Python library. A new row is then added to the table of the Columns /CDEs Mappings component and the user can edit the mapping (change the CDE code, define the transformation to apply to the column values, etc.) by using the Mapping Row Editor:
3.2 Semi-automatic approach
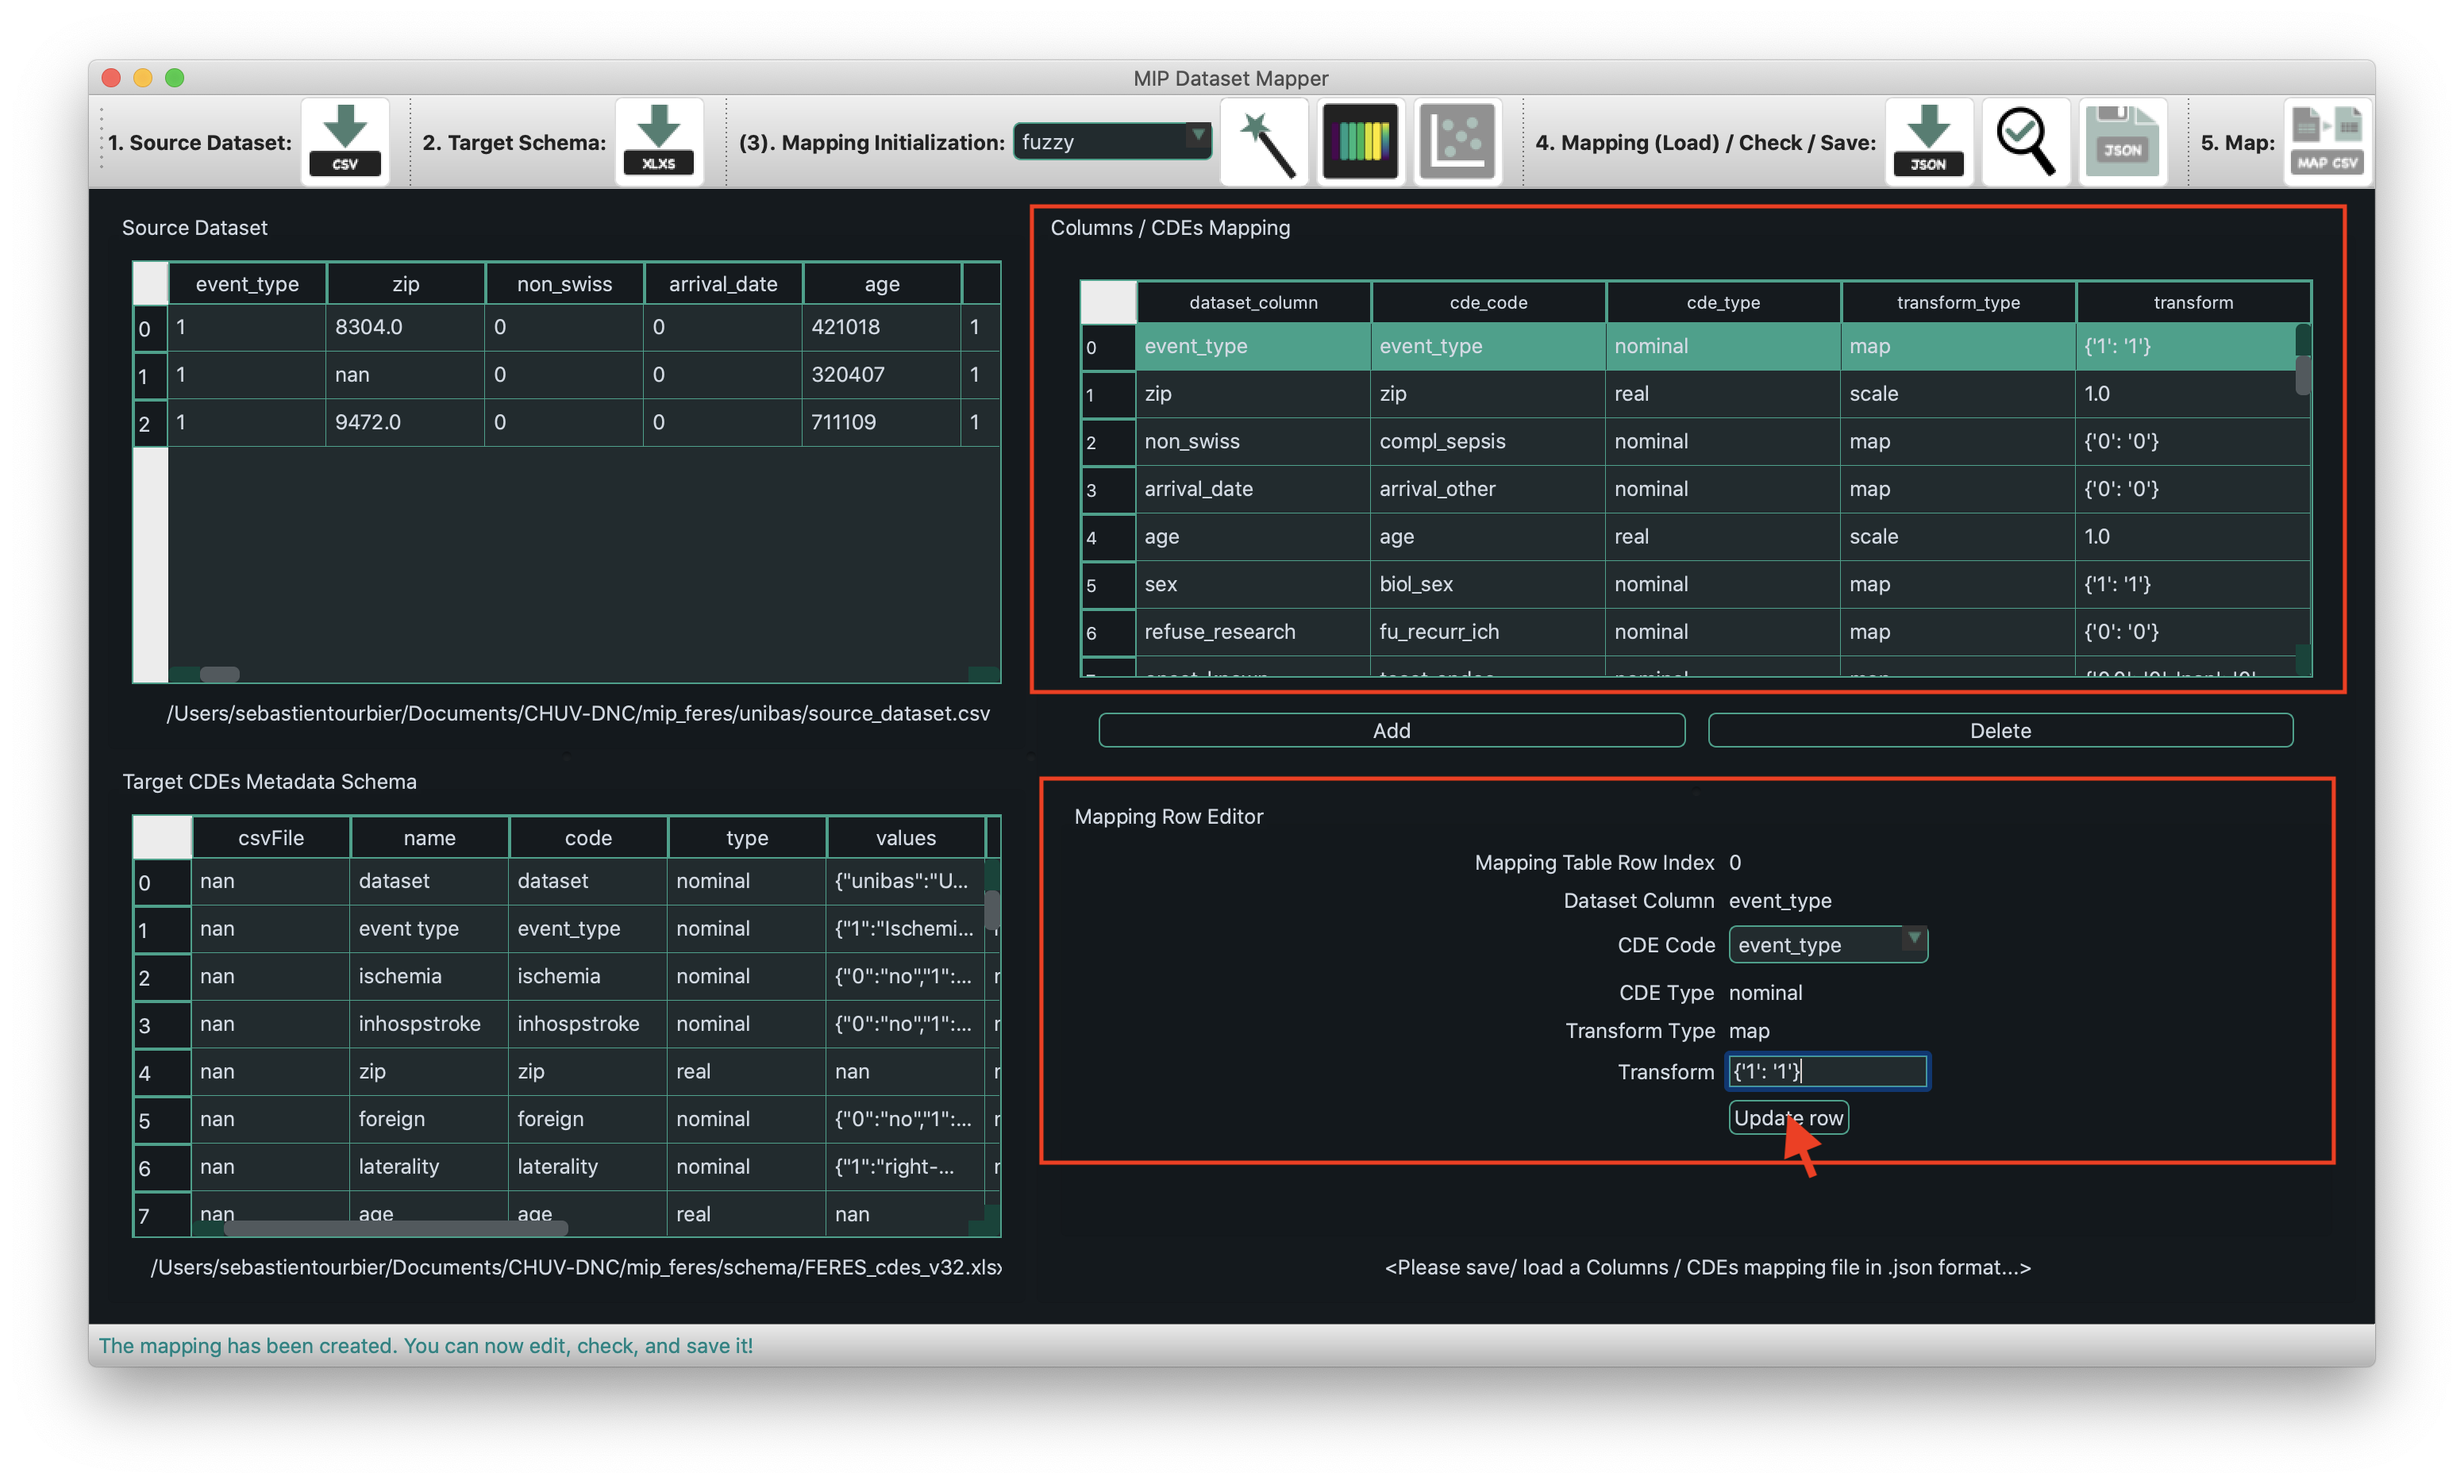
The semi-automatic approach consists in initializing the mapping of all columns of the source dataset automatically by using one of three Natural Language Processing (NLP) methods (fuzzy, glove, chars2vec). The method can be selected from the dropdown list and then can be performed by clicking on the Magic Stick button of the Mapping Initialization component of the menu bar:

This will initialize the mapping of all columns of the source dataset automatically by leveraging the selected NLP method. The user can then edit the mapping (change the CDE code, define the transformation to apply to the column values, etc.) by using the Mapping Row Editor:
4. Check / Save the mappings
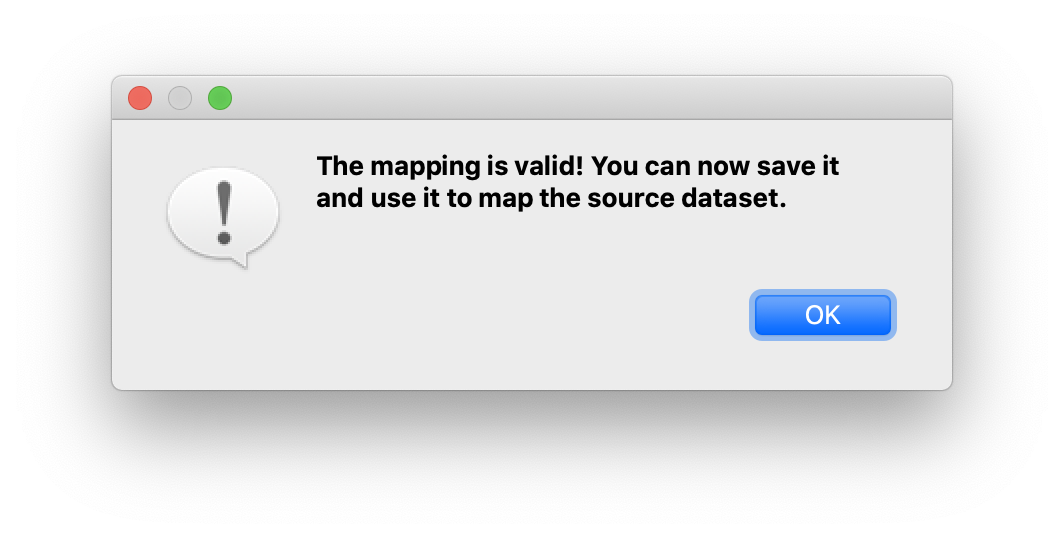
The fourth step of the UI workflow is to check the mappings. This can be done by clicking on the Check button (magnifying glass) of the Mapping (Load) / Check / Save component of the menu bar:

This will check the mappings and display the result in a pop-up window:
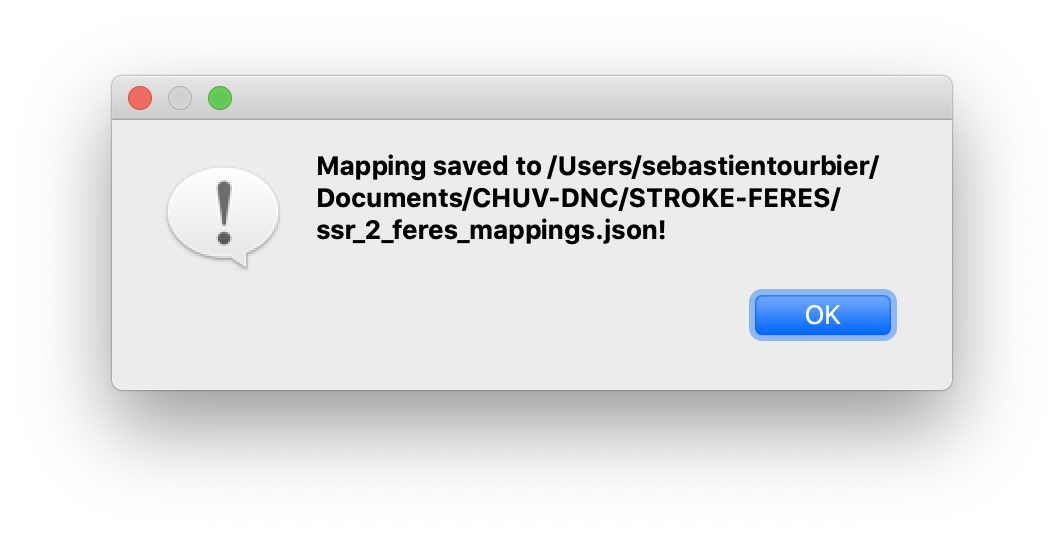
Once the mappings of the table are validated, the fourth step of the UI workflow is to save the mappings. This can be done by clicking on the Save JSON button of the Columns /CDEs Mappings component of the menu bar:

This will open a file dialog window allowing to select a JSON file. Once a JSON file is selected, the mappings are saved in the file, and the result is displayed in a pop-up window:
This file can be then used by both the commandline and the UI applications of the MIP Dataset Mapper (mip_dataset_mapper and mip_dataset_mapper_ui).
5. Map a dataset
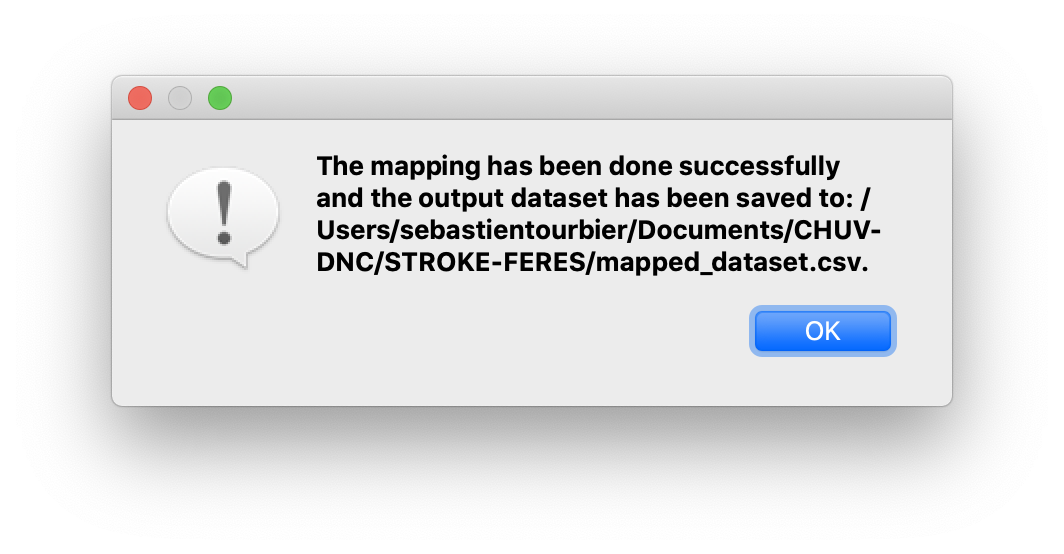
Once the mappings are saved / loaded, the user can map a dataset by clicking on the button of the Map component of the menu bar:

This will open a file dialog window allowing to select a CSV file. Once a CSV file is selected, the source dataset is mapped and the result status is displayed in status bar of the window: